AQA Physics
Wave-Particle Duality
12.2.1 Newton’s Corpuscle Theory
Newton said light is made of weightless particles called corpuscles.
A few days after that, Robert Hooke said light must be a wave. Because of diffraction experiments he’d done on light.
A few years later, Dutch scientist Huygens said light must be a longitudinal wave that travels through “ether”.
Ether was assumed to be an invisible medium that permeated everywhere including vacuum! We will talk about it more in 12.3.1 Michelson-Morley experiment and show that actually it is a myth!
Huygens’ Principle:
Huygens said any point on a wave front can act as a new wave!
(Wave front: a line or surface on a wave on which all points have the same phase)
These new waves care spherical in shape and are called secondary wavelet!
The new wave front is tangential to the secondary wavelets.

Huygens ’ Principle could explain reflection, refraction and why light slows down when it enters a denser medium.
It also could predict the diffraction through a narrow slit.
But could not explain why light creates a shadow when shone on an object, while water wave or sound diffract around the object.

After Huygens death, Newton came along again with his corpuscle theory and tried to explain shadows, reflection and refraction.
He said:
Shadows: corpuscles are stopped by the object, hence we get sharp shadows.
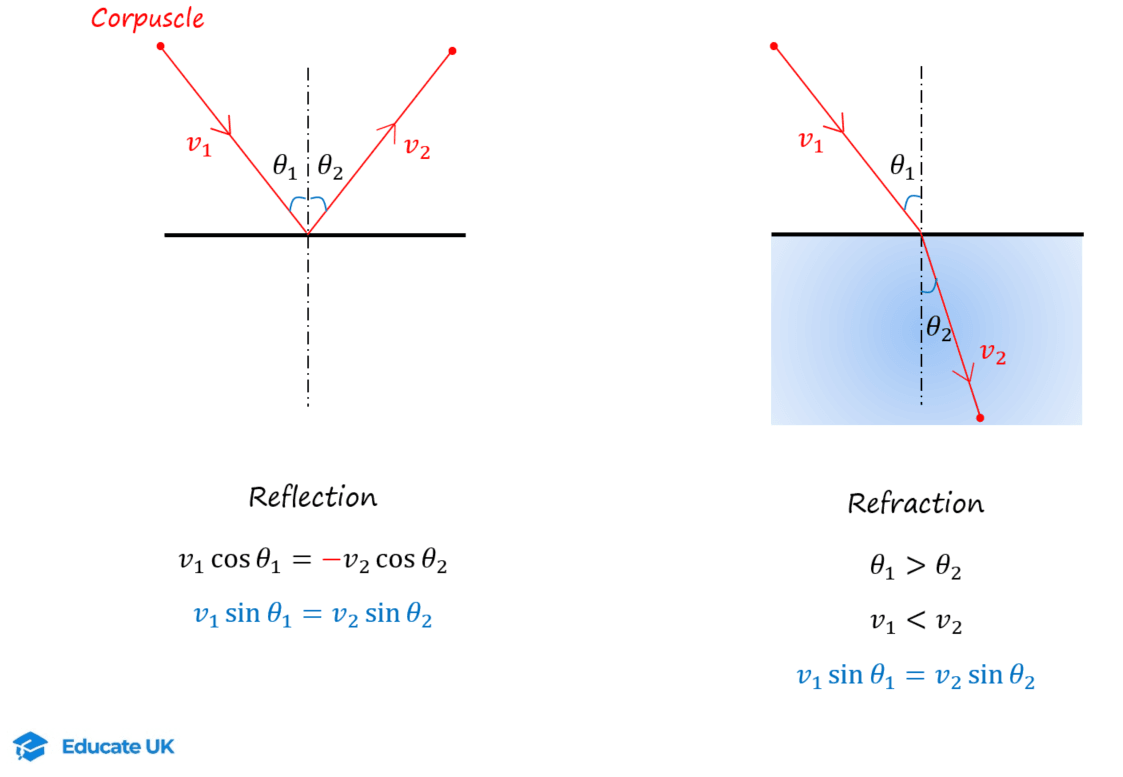
Reflection: corpuscles hit the surface and thanks to conservation of momentum, the component of velocity perpendicular to the surface is reversed, but the component parallel to the surface is unchanged. Because he observed
 .
.Refraction: component of velocity parallel to the boundary is unchanged. But because
 , he said light travels faster in the denser medium! Meaning the denser medium applies an attractive force on the corpuscles!
Newton’s corpuscle theory could not explain diffraction through a narrow slit.
But because he was more famous and because Huygens could not explain shadows, Newton’s theory dominated the field for the following hundred years!
12.2.2 Young’s double slit experiment
Almost a hundred years later, Young with his double slits showed that light must be a wave.
The light source for the two slits had to be from a single source so that waves had constant phase difference. We call this coherent wave sources.

Young did not have laser, so he used a single slit (S1) first to make the light from a non-coherent source (like candle), more coherent!
Light goes through the single slit (S1) and diffracts.
Then by going through the double slits (S2) we have coherent wave sources that interfere with each other.
This produces a pattern of bright and dark fringes on the screen (F).
A bright fringe is produced when the path difference (cd – bd) is a multiple of wavelength (nλ).
A dark fringe happens when path difference = ![]() .
.
If Newton’s corpuscle theory was right, the fringe pattern would have been just two bright fringes.
At this time they knew interference was a property of waves.
Hence Young said light is a wave! And claimed Huygens was right!
Majority of scientists still resisted this idea!
Until two French guys measured speed of light in water and showed, contrary to Newton’s belief, light slows down in water!
12.2.2.1 Measurement of light’s speed
Fizeau from France made a device like what you see below to measure light’s speed.
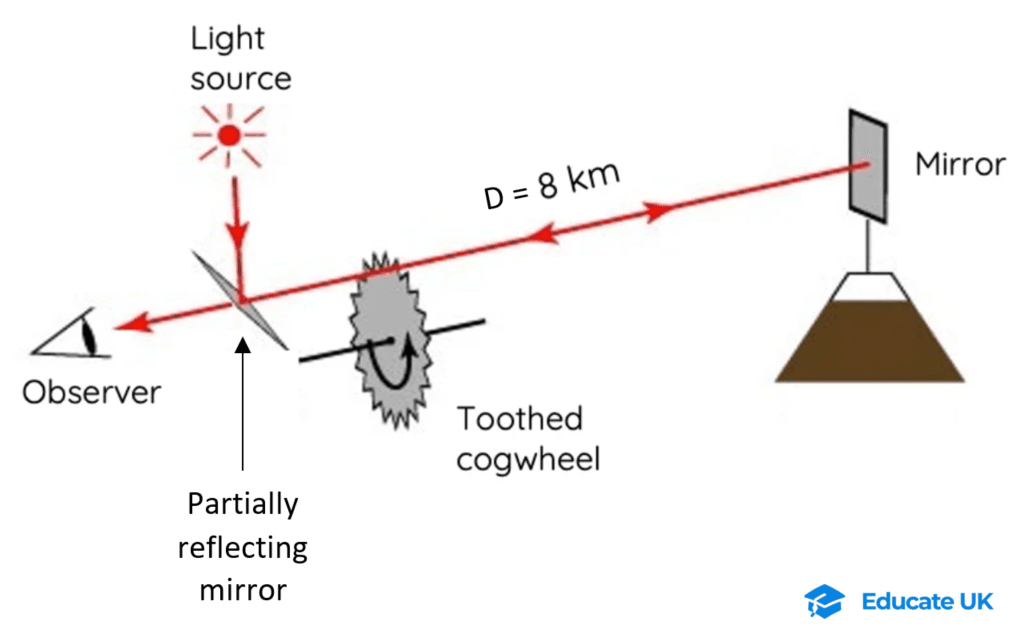
Light from the source was reflected by the partially reflecting mirror towards a mirror placed kilometres away (D).
The distant mirror reflects the light towards a toothed wheel and an observer.
When he rotated the wheel, the teeth would block the light coming from the distant mirror.
So he would see pulses of light through the teeth.
If he increased the speed of wheel’s rotation, there would be a point that the light would totally be stopped by the teeth.
This happens because a beam of light going towards the distant mirror would pass through a gap between the teeth, but when was reflected by the distant mirror, it was stopped by the tooth next to that gap.
Meaning the wheel was rotating fast enough to block the light which was reflected by the distance mirror.
There are N teeth on the wheel, and hence N equally spaced gaps as well.
T : time period of the wheel (time to complete one revolution).
Hence the time, t, to travel through one tooth’s width is:

Because:
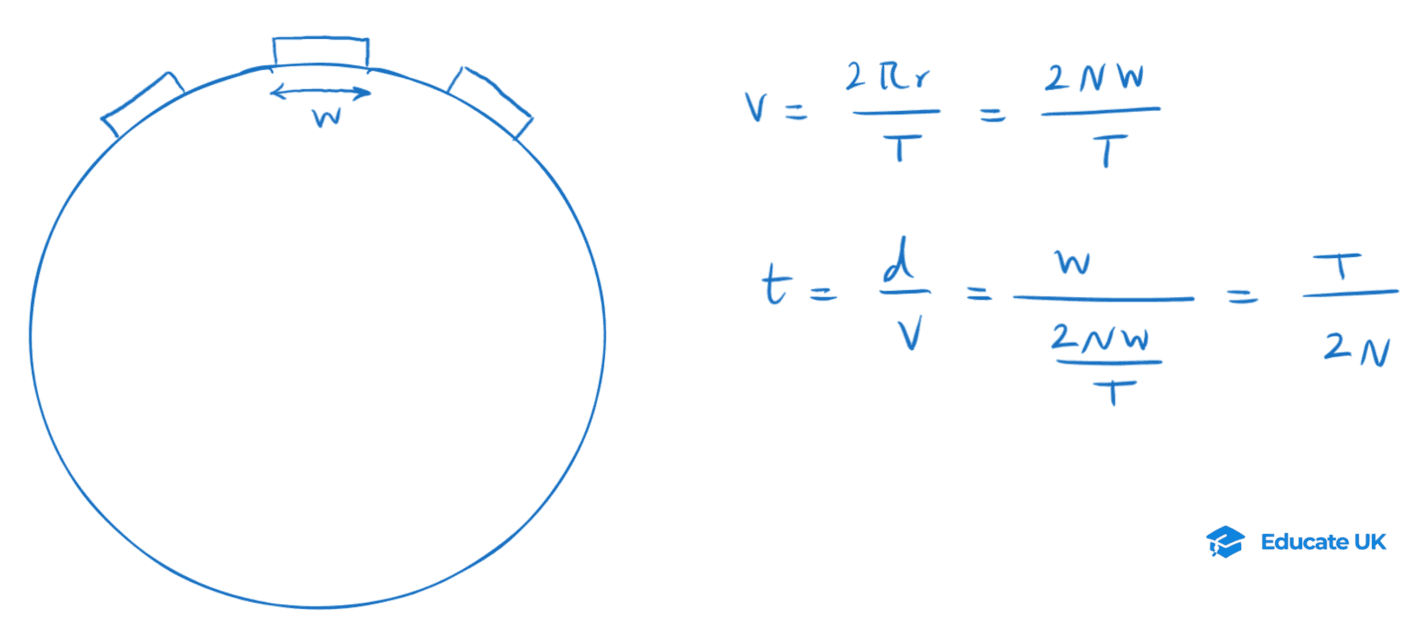
Since ![]()

Light travels a distance of 2D in time t, hence light speed, c, is:

12.2.3 EM Waves
EM waves are created when a changing magnetic field creates a changing electric field, which then in turn creates another changing magnetic field, and this continues.
Electric and magnetic fields oscillate in phase at right angles to each other.
EM waves can travel through vacuum.
Today we know they are transverse wave, contrary to what Huygens had suggested.
Maxwell formula for speed of EM waves in vacuum:
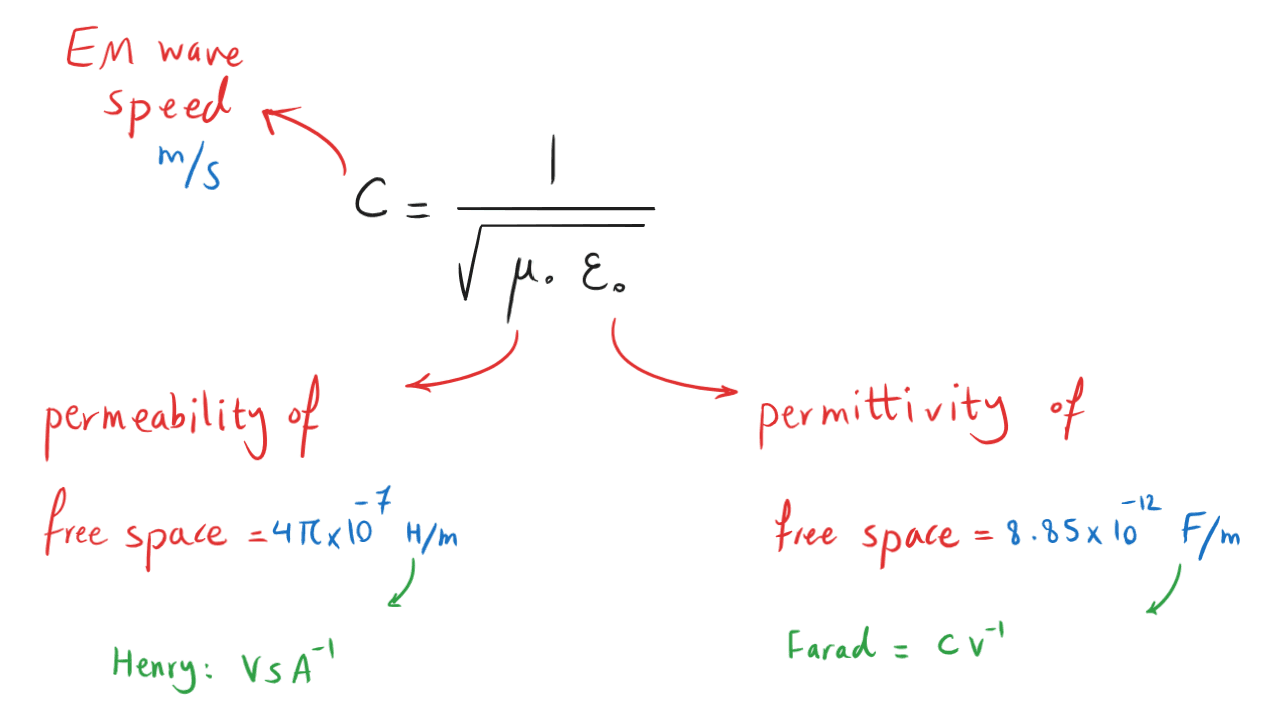
Permeability of free space is for magnetic field.
Permittivity of free space is for electric field.
Heinrich Hertz produced EM waves by a spark created by electrical discharge.
Hertz’s transmitter shown below created high alternating voltage, which charged the brass capacitors.
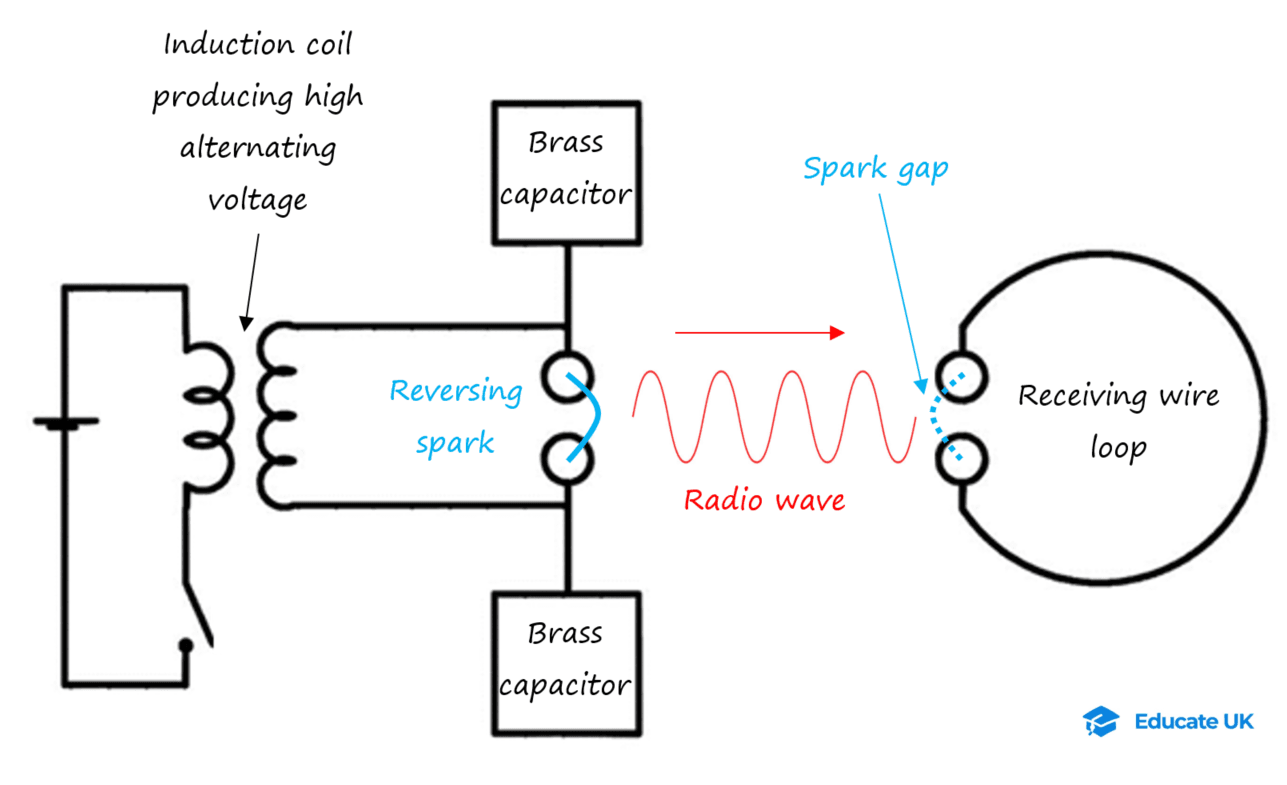
Discharging the capacitors created a spark which reverses direction all the time because the PD is alternating.
He noticed that these sparks could induce sparks in a wire loop placed near the transmitter.
This meant a current is induced in the loop.
An unexpected result of Hertz’s experiment was discovery of photoelectric effect!
Later the EM waves that Hertz discovered were called Radio waves!
Hertz placed a metal sheet near the transmitter and created stationary waves.
He moved the wire loop receiver in between the transmitter and the metal sheet and recorded the distance between the nodes.
From which he got the wavelength and then calculated the speed of EM waves which was close to Maxwell’s value.


Where n is the number of nodes.
By rotating the wire loop receiver Hertz also showed that radio waves are polarised.
12.2.4 Discovery of Photoelectricity
Black body: perfect emitter and absorber of thermal radiation.
So it does not reflect or transmit EM waves.
A black body cannot emit all of its energy over all wavelengths at once.
12.2.4.1 Wien’s displacement law
Diagram below shows how intensity of radiation emitted from a black body changes with its temperature.
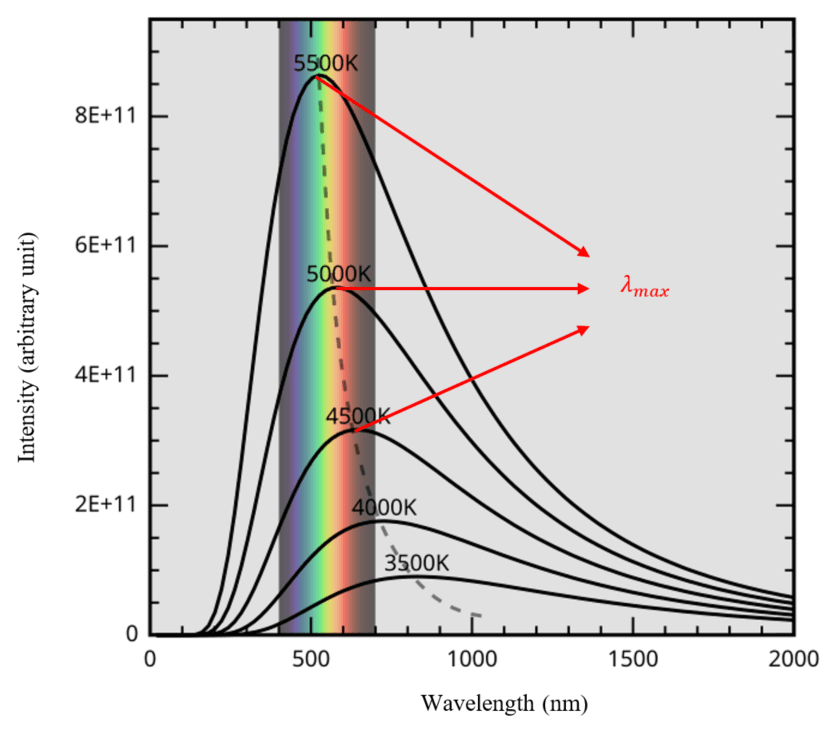
As it can be seen for every temperature, there is a wavelength for which maximum intensity of radiation occurs. We call this wavelength peak wavelength: ![]() .
.
As the temperature of an object decreases, λmax increases, and the distribution of EM wave emitted changes.
This is called Wien’s displacement law.
It basically says: peak wavelength is inversely proportional to temperature in Kelvin.
12.2.4.2 Ultraviolet Catastrophe
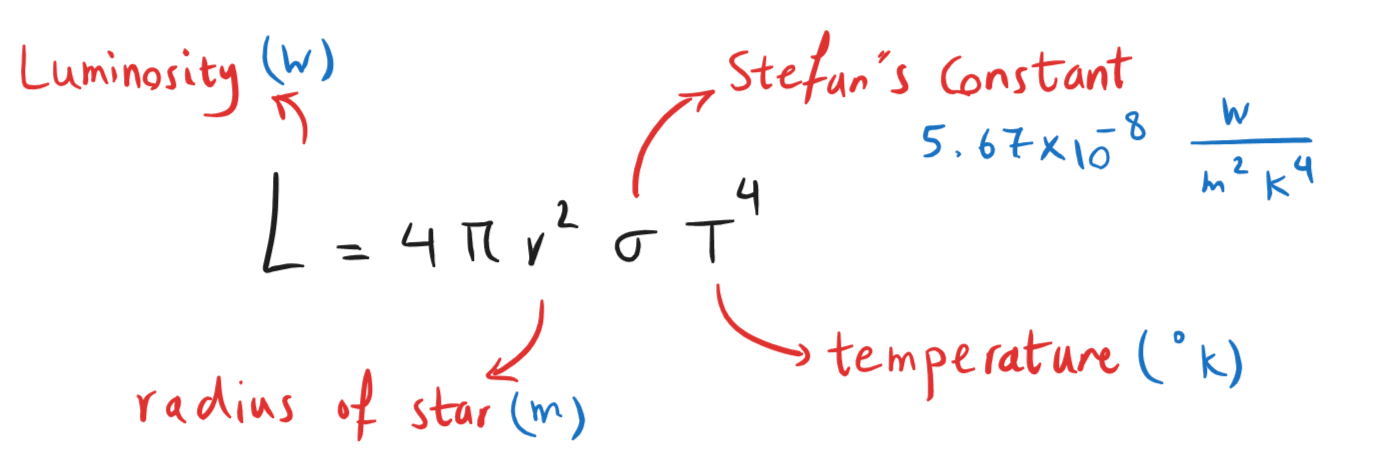
Stefan-Boltzmann law is an empirical equation that relates the total power radiated by a black body to its forth power of temperature (in Kelvin).
The equation is not part of AQA specification, but if you are interested this is the equation:
But then Rayleigh–Jeans tried to derive a theoretical equation for the Stefan-Boltzmann’s empirical equation.
Their equation would correctly predict the shape of radiated power at longer wavelengths.
However at short wavelengths their equation predicted that radiated power per unit wavelength becomes infinite!
This is called the ultraviolet catastrophe.
This predicted that at normal temperatures, objects should emit a lot of UV or even X-ray, which did not agree with observations.
Now you may think this was a rubbish explanation of the UV catastrophe, then I would say you are not wrong!
But I also should say AQA physics books are not the best either!
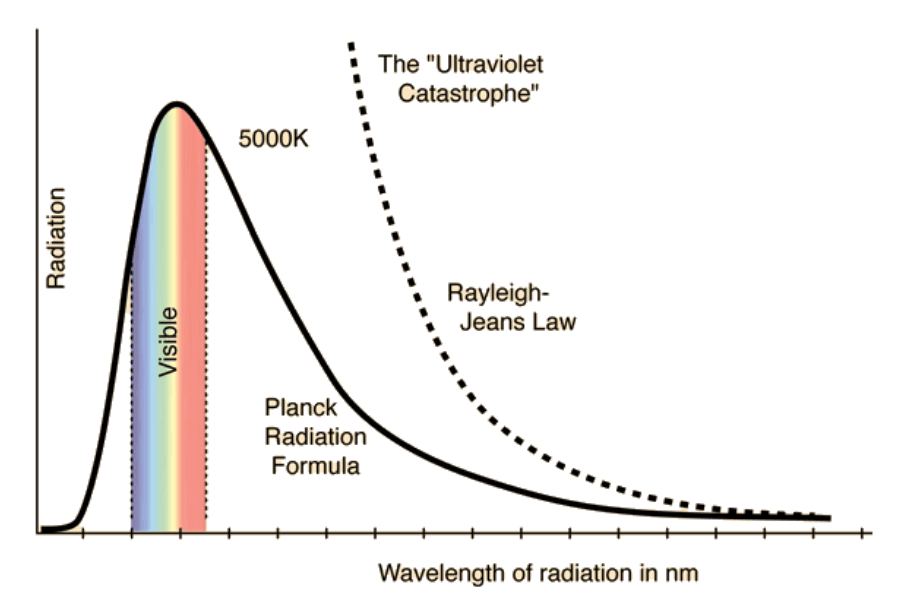
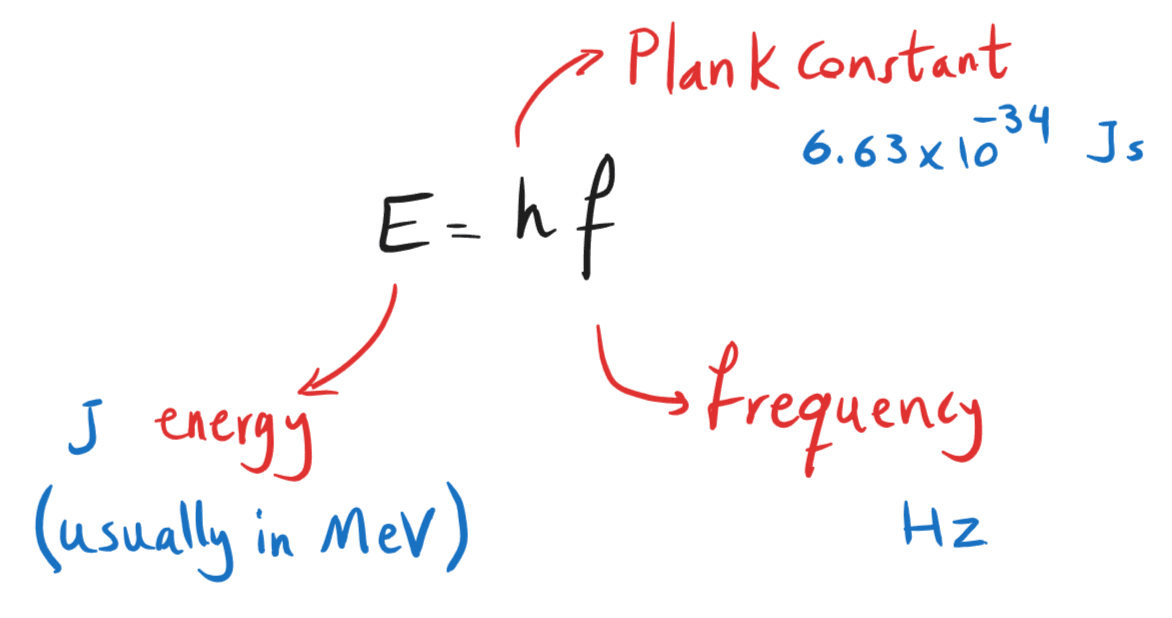
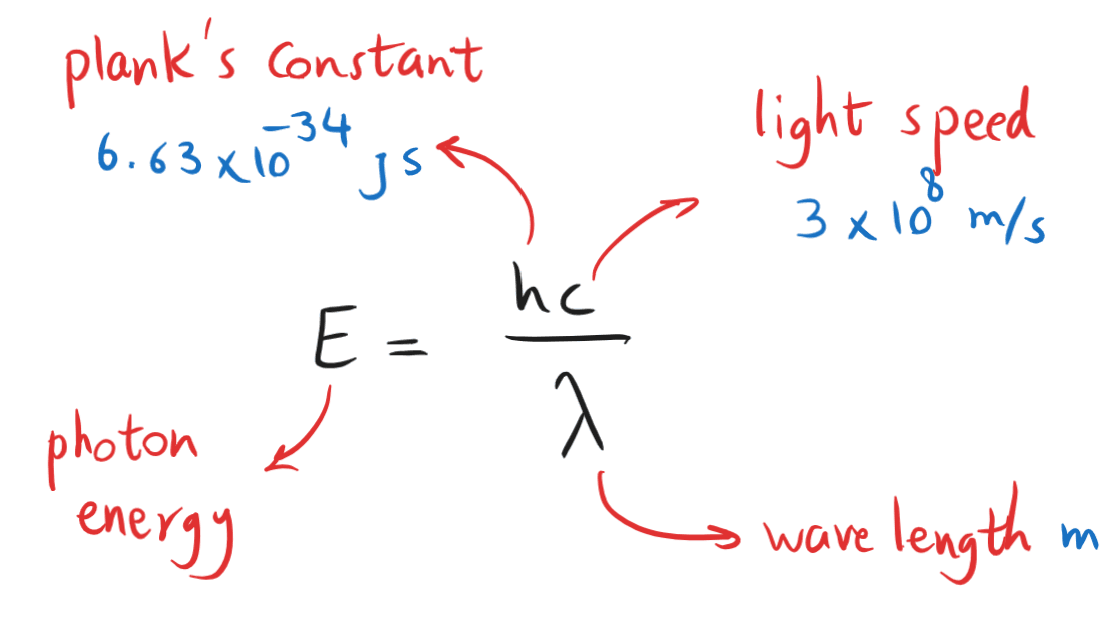
Then Plank came along and solved the problem by saying energy of EM waves is quantised! And not continuous.
He said this energy is proportional to the frequency of the EM wave.
Plank was able to successfully predict the shape of intensity vs. wavelength curve.
However Plank’s idea was not widely accepted, until Einstein tried to explain the photoelectric effect.
12.2.4.3 Photoelectricity
Photoelectric effect: when light of certain frequency is shone on a metal surface, electrons can get enough energy to escape the metal.
Hertz was the first one to report photoelectricity.
When he was playing with his radio wave transmitter, he noticed the sparks in the receiving wire loop are stronger if UV is shone on the electrodes!
Now you may ask what the hell was Hertz playing with that at the same time when he is playing with the radio transmitter, he’s got UV there somewhere shining on his stuff; then I would say only heaven knows!
That was in 1887 for feck’s sake!
Later research by Stoletov and Lenard (you don’t need to know the names) showed:
No electrons were released if light’s frequency was lower than a certain value, called the threshold frequency; which depends on type of metal;
When light with higher than threshold frequency is shone on the metal, electron are realised immediately;
Electrons are released with a range of KE up to a max value;
Doubling the light intensity, doubles the number of electrons released, but does not affect their max KE;
Increasing the light’s frequency would increase the max KE;
Red light does not release electrons from any metal!
The explanation of photoelectricity with Huygens wave theory had some issues:
Huygens theory assumed light is a continuous energy spread evenly on a wave front. And the energy depends on amplitude. But KE of photo electrons depends on frequency!
Huygens assumed each electron would receive some of the energy from the wave front, so after a little time electron would get enough energy to leave the metal surface, but photoelectricity is instantaneous!
Huygens would say even low frequency of light would emit electrons, but it would take longer, but again we know that is not the case!
Also if light was a continuous wave of energy, brighter (more intensity) would result in higher max KE of electrons, but again…
All of these lead Albert Einstein to use Plank’s idea that energy of light is E = hf.
And to say that light (or all EM waves) actually is packets of energy called photons.
So the photons and electrons have a 1-to-1 interaction.
Each electron absorbs a photon as a whole and just eats it up, that’s how it gets the energy to get out of metal surface!
For the electron to leave the metal, it needs to overcome the attractive force of the ions in the metal lattice. The min of this energy for a metal is called work function (Ф).
So some of the photon energy (hf) is spent on the work function and the rest will be the KE of electron, which will be maximum KE because work function is the minimum required!
So we get:

Some other electrons deeper in metal need more energy than Ф to be released, hence their KE will be less than the KEmax.
If hfo = Ф electron will escape the surface but has zero KE! In this case the photon frequency is called the threshold frequency (f0).

12.2.4.4 Stopping Potential (Vs)
Millikan tested Einstein idea with a circuit like this:
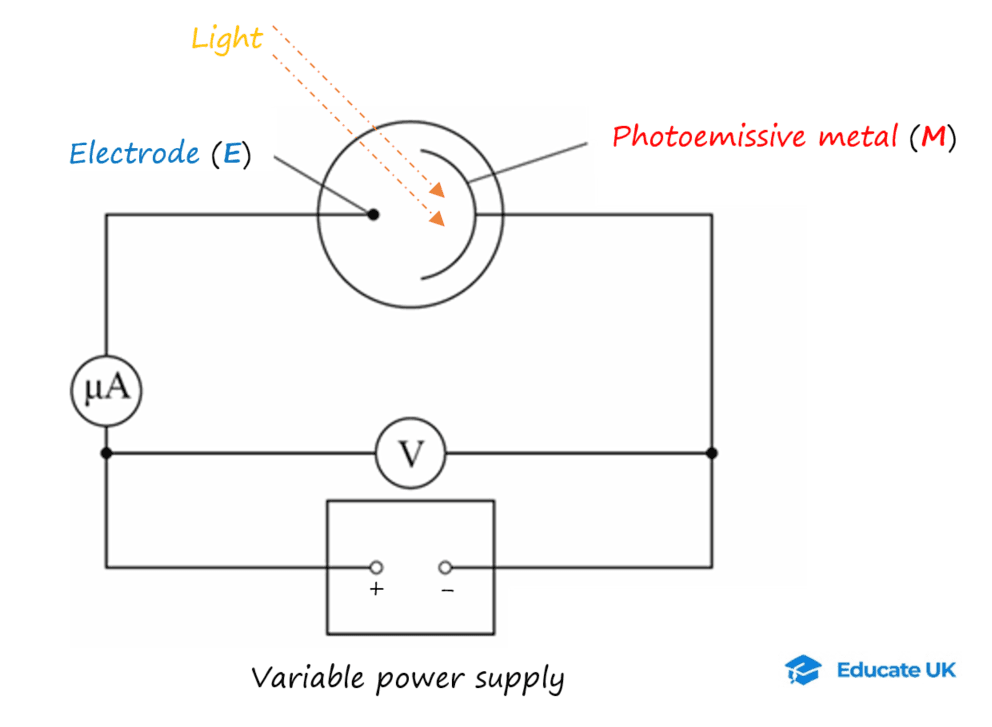
The electrons ejected from the Photoemissive metal (M) are attracted to the electrode (E). M and E both make a photocell!
This creates a PD and current in the circuit. I call this photocurrent!
As long as PD from the variable power supply is less than PD from the photocell, photocurrent flows. In the circuit above it will be anticlockwise.
Millikan gradually increased the PD from the variable power supply, until the micro ammeter reads zero.
This means the opposing PD from the variable supply is equal to the PD created by the photocell.
Which means photoelectrons with highest KE ejected from M, cannot reach E.
We call this PD the stopping potential (Vs) because it stops the photocurrent!
Stopping potential formula:
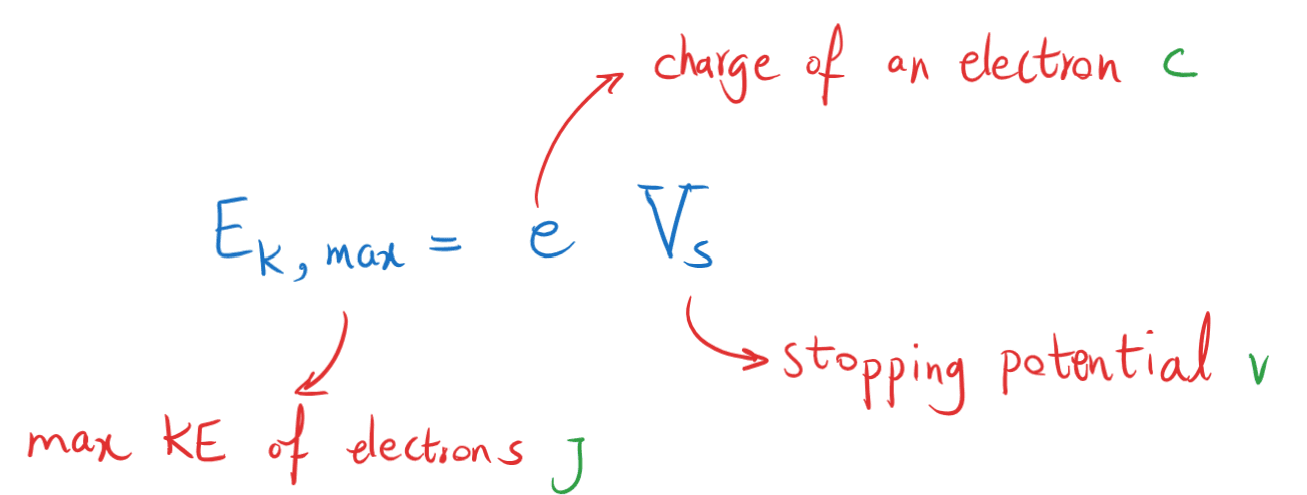
1 electron-volt: energy required to move an electron in a PD of 1 volt.
This comes from definition of PD:
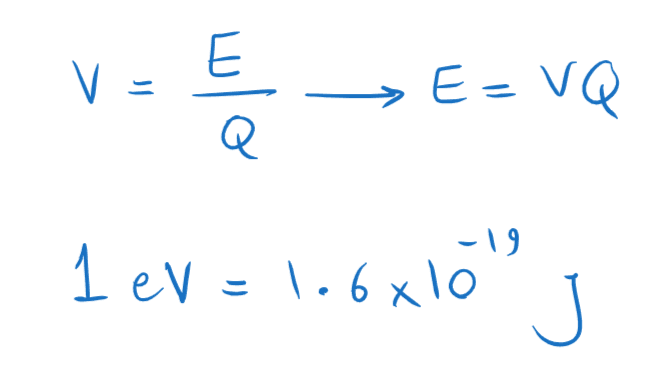
Using the definition of electron-volt, the stopping potential formula gives us the KEmax in eV directly if the PD is in volts.
Plank constant:
If for a metal we change the light’s frequency and record the KEmax in Joules, we get a line graph.
Gradient of this line is the plank’s constant.
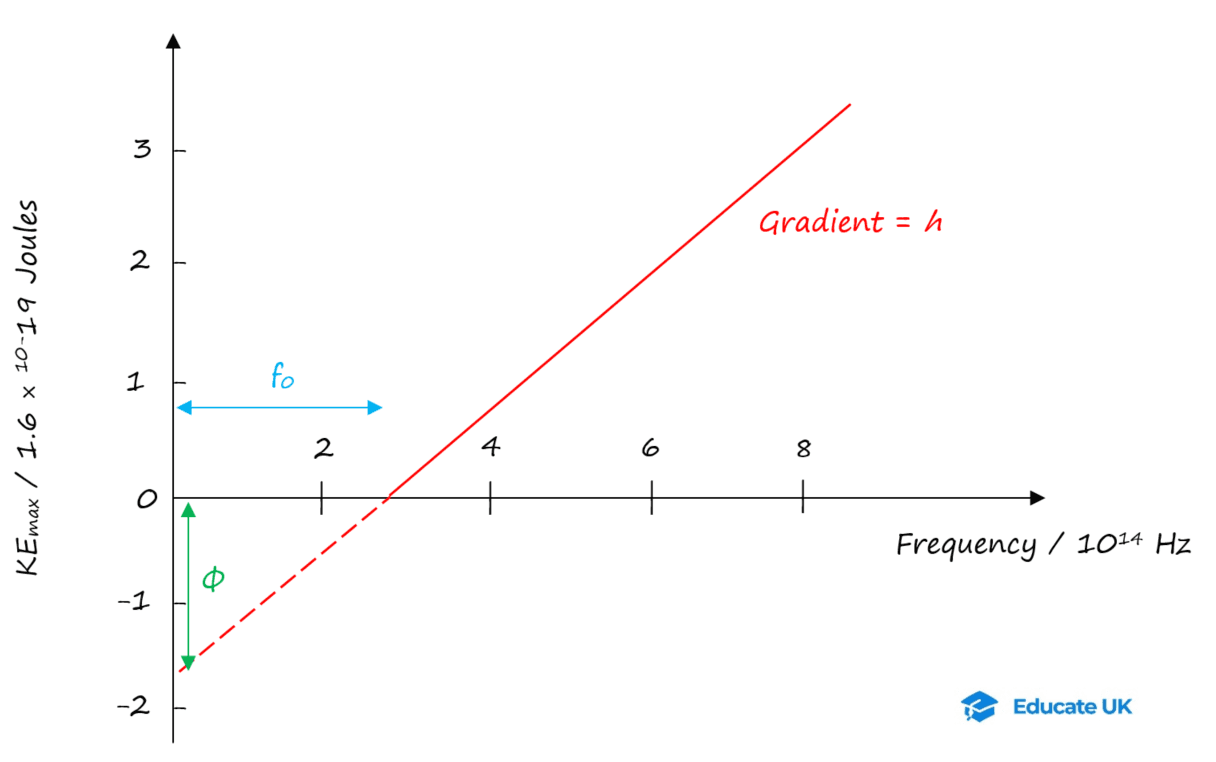
The y-intercept is the work function (Ф).
The x-intercept is the threshold frequency (f0).
So Einstein quantum idea of EM waves was accepted.
Today we say photon has a dual wave-particle nature.
12.2.5 Wave-Particle Duality
Double slit experiment showed light is a wave.
Photoelectric effect showed it is quantised also.
This is called wave-particle duality.
Einstein said the light photons also have linear momentum.
Luis de Broglie (read “de Broy”) said:
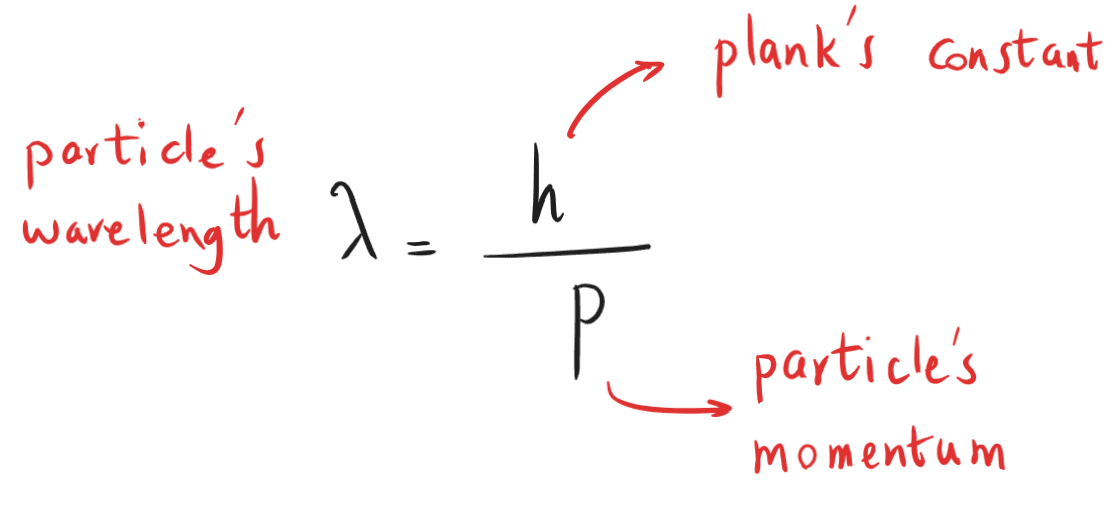
De Broglie later thought if light which is wave acts like a particle, is it possible that particles like electron act like wave?
He came up with this formula for wavelength of particles:
This was confirmed by passing a beam of electrons through a target material acting as the diffraction grating.
Electrons were generated from an electron gun.
They accelerated towards an anode with PD of V in a vacuum tube.
Then passed through the diffraction grating.
And we can write the de Broglie formula like this too:
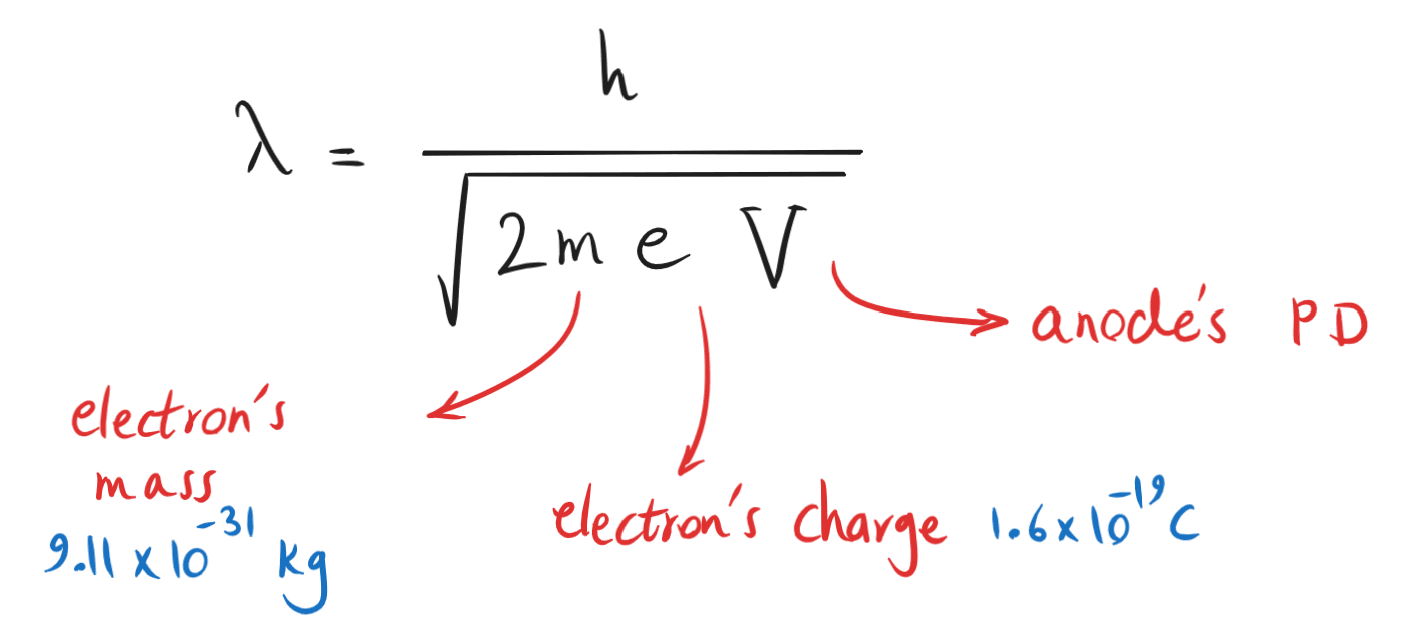
This formula shows electron’s λ depend on anode’s PD.
If PD goes up, λ decreases, and hence the concentric circles of diffraction pattern will be more tightly spaced.
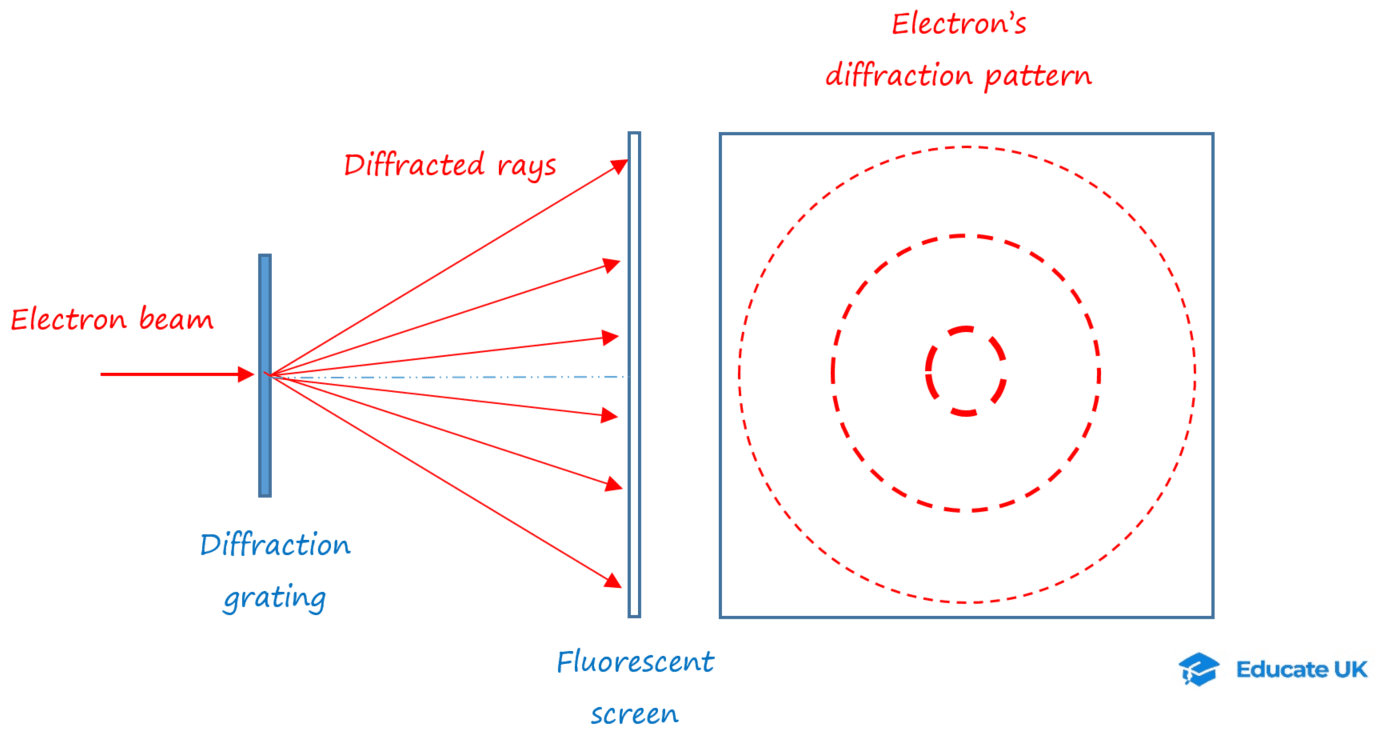
Diffraction patterns have been achieved with other particles: e.g. protons, neutrons, and atoms!
Diffraction pattern also gives information about the target material (diffraction grating) itself. E.g. space of atoms in there.
As a rule of thumb a photon can probe into distances almost equal to photon’s wavelength.
That’s why we cannot see crystal’s lattice spacing with visible light. Because the spacing is smaller than visible light’s wavelength.
But we can adjust electron’s wavelength with anode’s PD.
The shorter the λ, more detailed information we can get about the target material.
X-ray’s λ can be small and used too, but we can reduce electron’s λ even smaller than that!
This is how electron microscope work!
12.2.6 Electron Microscope
There are two main types:
12.2.6.1 Transmission electron microscope (TEM)
Magnification power: x 400
Electrons generated from electron gun, and accelerate towards anode;
Anode voltage up to 300 kV;
Accelerated electrons pass through a “condenser lens” which widens the electron beam using a magnetic field;
Electrons go through a very thin target material (specimen), and they may be absorbed (stopped), pass straight through or diffract;
The objective aperture after the specimen is set to smallest opening so that it absorbs all the diffracted electrons. We don’t want them in the final image!
The electrons passing through hit a fluorescent screen, which gives off light;
Bright areas on the final image shows thinner or less dense part of the specimen;
Dark areas show thicker or higher density;

The electrons in the beam are considered “monochromatic”, because majority have the same λ.
But after collision with specimen’s atoms, some go slower and hence have longer λ. Which reduces image resolution.
This is called material dispersion or “chromatic aberration”.
Also electron microscope should be protected from vibration during operation.
No game balls in the room with TEM in it!
Another technique to use TEM:
Electron beam is narrowed by the magnetic lens to focus on a single crystal in the specimen;
The objective aperture is widened so that diffracted electrons contribute the final image as well;
Final image is a dot pattern which is characteristic of each specimen;
The specimen may be tilted so that electron beam hits at different angles, producing different dot patterns;
Final images give us info about crystal structure and its dimensions.
12.2.6.2 Scanning tunnelling microscope (STM)
Waves can pass through a barrier if their amplitude is not reduced to zero by the barrier.
If you have a thin metal sheet, light can pass through it! Try it!
Or look at this video.
Electrons act as waves too.
So they can pass through a barrier e.g. an air gap if it is small enough.
The thickness of the airgap has to be almost equal to the electron’s wavelength.
For most metals, at room temperature, de Broglie wavelength of electron is about 1 nm.
Now this is how STM works:
STM has a very small probe.
The probe scans small area of metals or semiconductors surface.
Tip of the probe is held 1 nm above the sample’s surface.
At this distance, electrons may travel from the probe to the sample or vice versa.
This travel of electrons is called quantum tunnelling.
If we apply a small PD between the probe and sample, we ensure electrons travel only in one direction.
We keep this PD constant throughout.
If we keep probe’s height constant at 1 nm, the fluctuations in sample’s surface causes change to the tunnelling current.
The smaller the gap between the probe and the surface, the higher the current.
The tunnelling current is sensitives to gaps as little as 0.001 nm!
The variations in current is used to generate an image of the sample’s surface.
The STM resolution of 0.001 nm is much smaller than the smallest atom.
This makes STMs a very powerful microscope.
STMs can be used in wide range of temperatures, in vacuum and in air.

Another mode of use of STMs is to keep the tunnelling current constant and change the probe’s height.
The image will be produced based on probe’s height.
Picture below shows atomic surface of a gold sheet.

.
Revise and Get Paid!
If you like taking summary notes of lessons and solving past papers, see the Join Us page!