AQA Physics
Uncertainty & Errors
Resolution: is the smallest division (graduation) on a device.
1.2.1 Reading or Measurement
We should distinguish between measurements and readings:
1.2.1.1 Reading
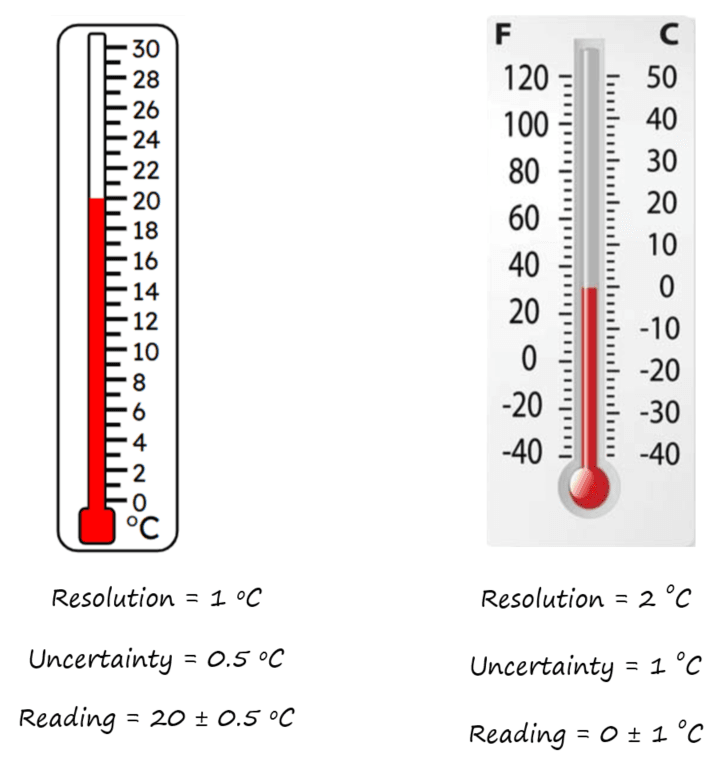
Readings: the values found from a single judgement when using an equipment;
E.g. when we read a value off a thermometer, you do this only once! You only look at the height of the liquid and the number closest to it, and that’s the temperature reading.
In this case we trust the zero, is a real zero!
In other words there are no zero errors in a thermometer.
Other equipment without zero error:
Digital Voltmeter and ammeter, pressure gauge, top pan balance, measuring cylinder, Geiger counter, thermometer.
Uncertainty of a reading: is half the resolution! (We call this absolute uncertainty).
1.2.1.2 Measurement
Measurements: the difference between the judgements of two values.
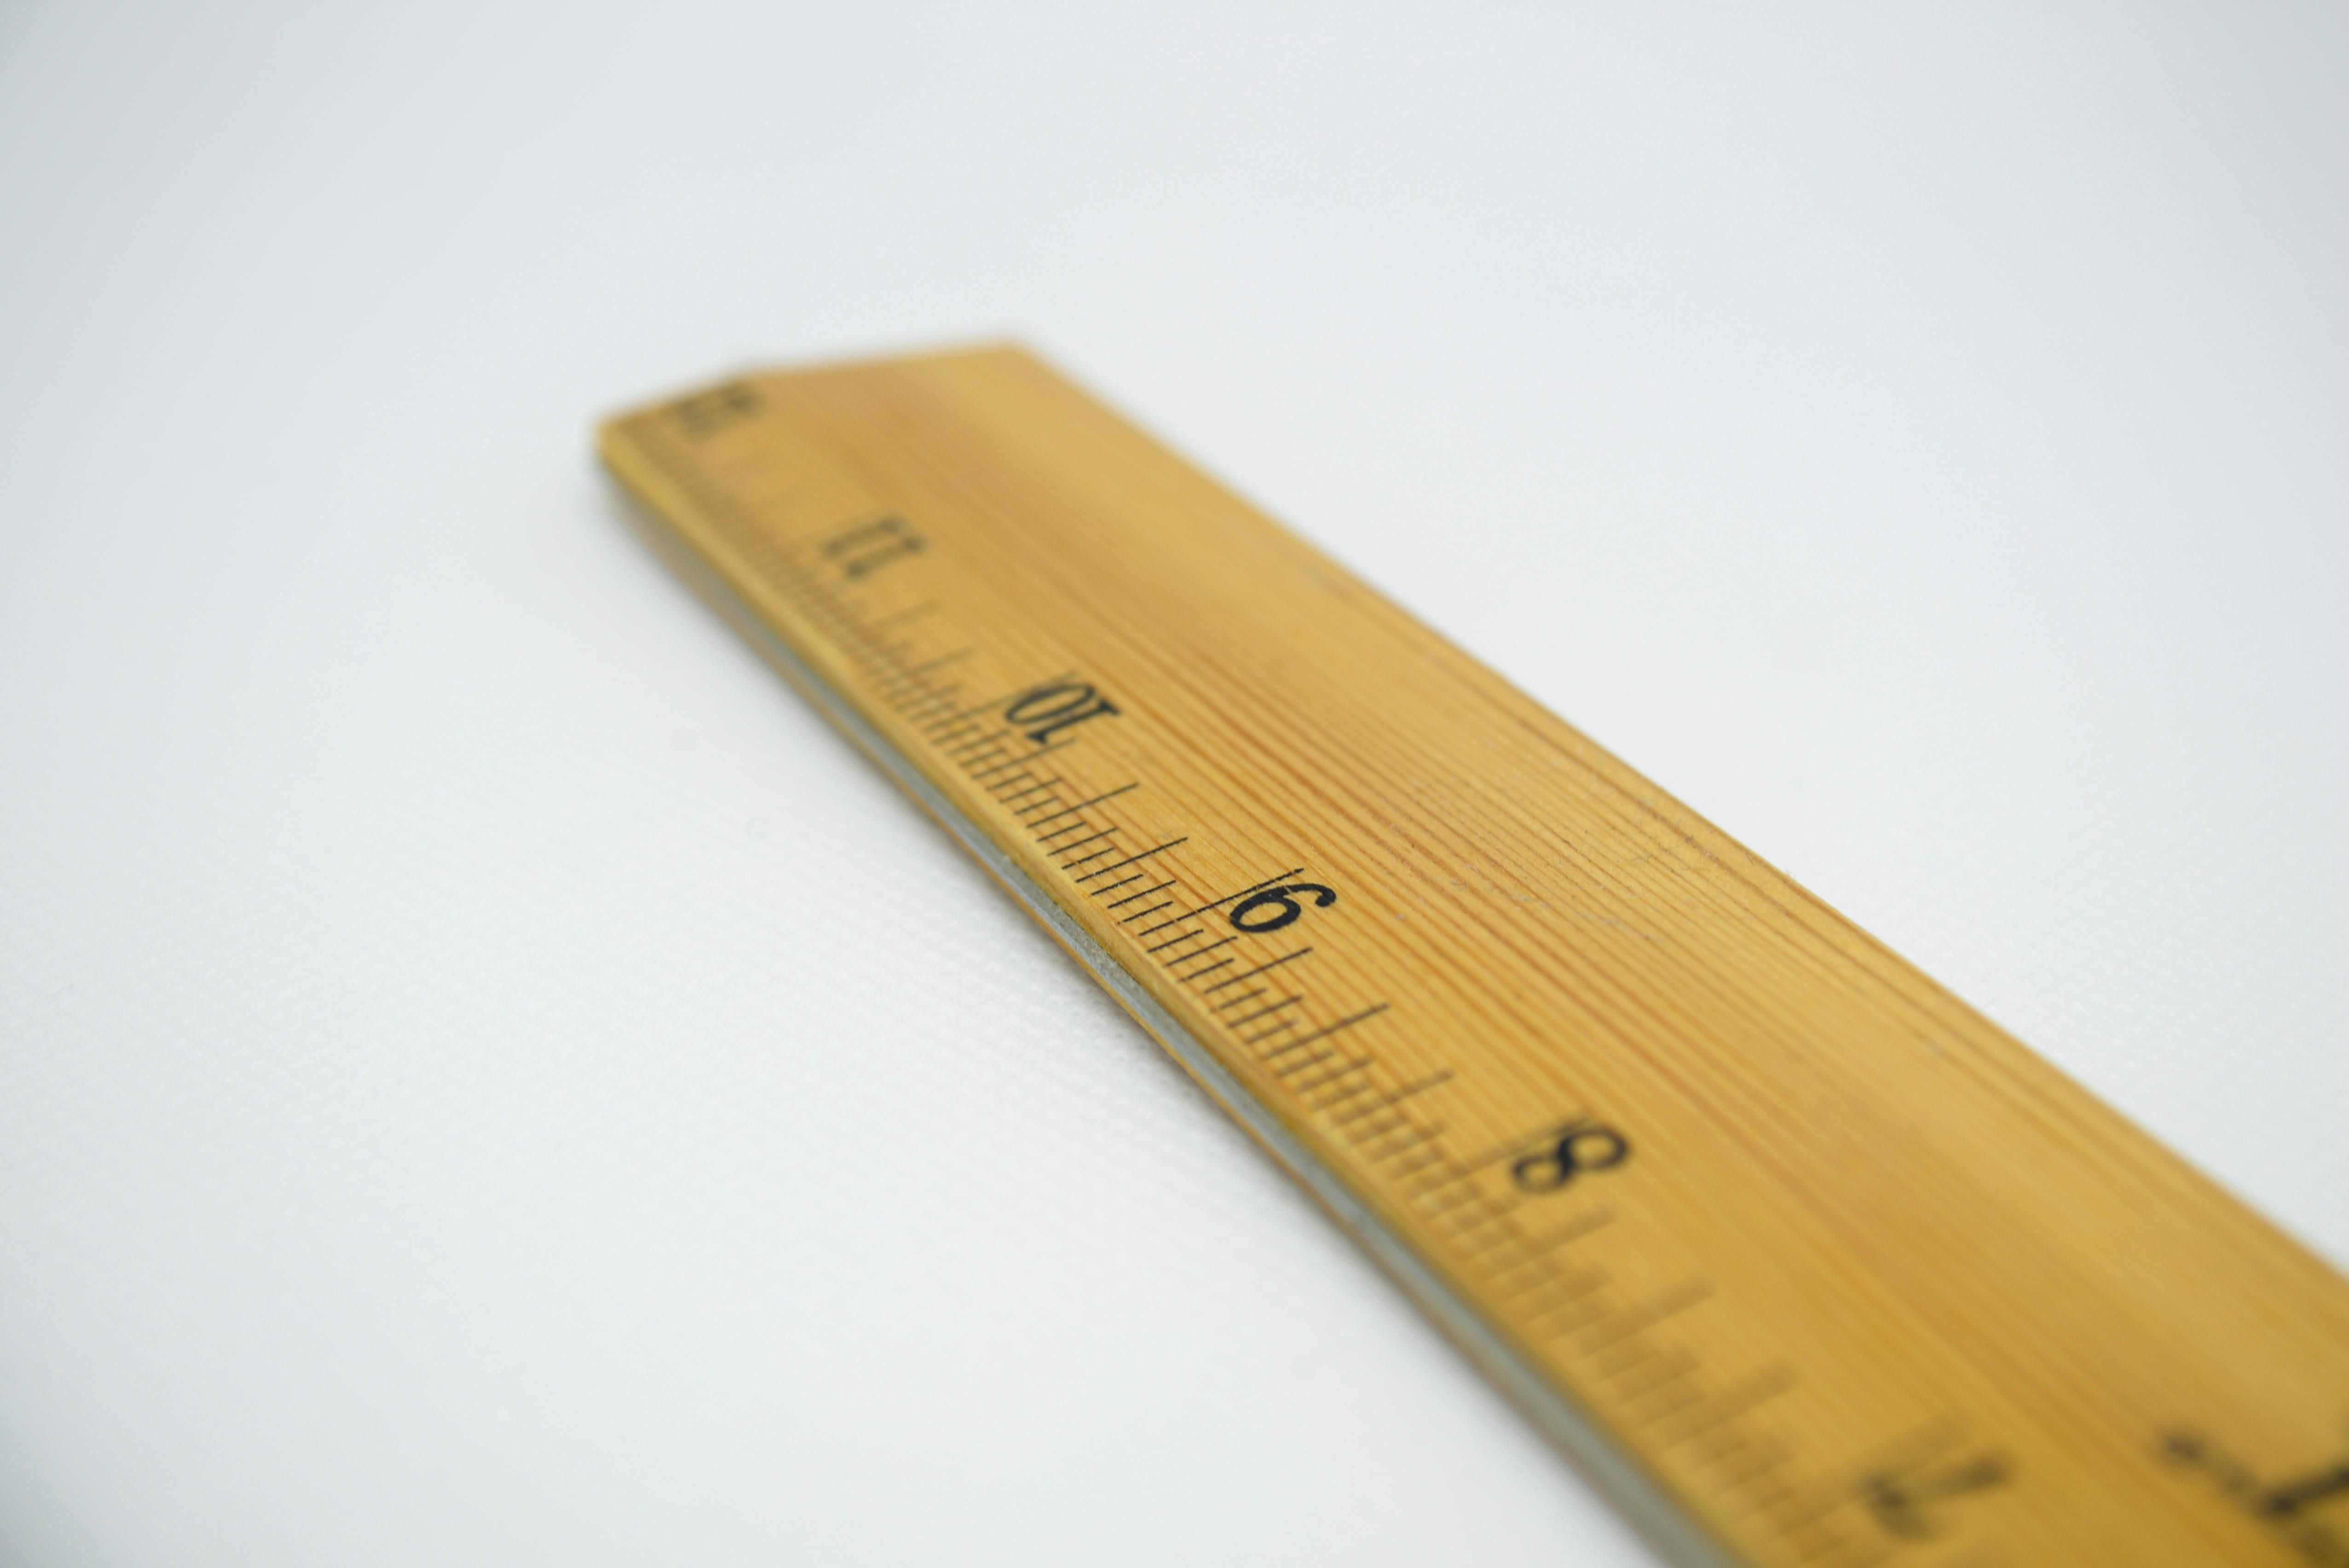
E.g. when using a ruler you make two judgments: one at the beginning and one at the end of the length, which leads to two uncertainties!
Ruler, stop watch, micrometre, Vernier calliper, protractor, analogue voltmeter and ammeter.
Uncertainty of a measurement = resolution.
e.g.

In both cases

Percentage uncertainty = absolute uncertainty / value
1.2.1.3 Given values
If the questions does not specify the type of device used, the uncertainty in reading/measurement will be ±1 in the last significant digit as the reported value.
e.g.
Reported value of current: 3.50 A
Uncertainty = ± 0.01 A
Or
Charge of an electron = 1.60 × 10⁻¹⁹ C
Uncertainty = 0.01 × 10⁻¹⁹ C
1.2.2 Multiple Measurements
We take several measurements to reduce the uncertainty.
Absolute uncertainty of a single measurement is the same as absolute uncertainty of the multiple measurements.
For example measuring the time period of multiple swings of a pendulum rather than just one!
Or measuring thickness of several sheets of metal, rather than just one.
e.g.
Time for 10 swings of a pendulum = 6.2 ± 0.1 s
Average time for one swing = 0.62 ± 0.01 s
1.2.3 Repeated measurement
Measuring the same thing multiple times to reduce uncertainty.
To find uncertainty:
Remove anomalies;
Find the average (mean);
Find the range. Range = max – min
Absolute uncertainty = range divided by 2;
Percentage uncertainty = absolute uncertainty / mean.

e.g.
Table below shows the measurements of dimeter, D, of a wire in mm:
Repeat | 1 | 2 | 3 | 4 | 5 |
D/mm | 0.25 | 0.26 | 0.27 | 0.24 | 0.25 |


So reported value = 0.25 ± 0.02 mm.

1.2.4 Graphs & Error bars
When plotting data on a graph:
Ignore anomalies;
Use the mean value for the data point;
Calculate the range of data;
Draw error bars with lengths equal to half the range on either side of the data point;
Draw the line of best fit, and find its gradient. Make sure you have the same number of data points at the top and bottom of the line.
Draw the steepest or shallowest line of worst fit. These should go through all the error bars. Choose the one with most difference from line of best fit and find its gradient.
Percentage uncertainty (%u) of the gradient is found by:

Percentage uncertainty (%u) of y-intercept is found by:

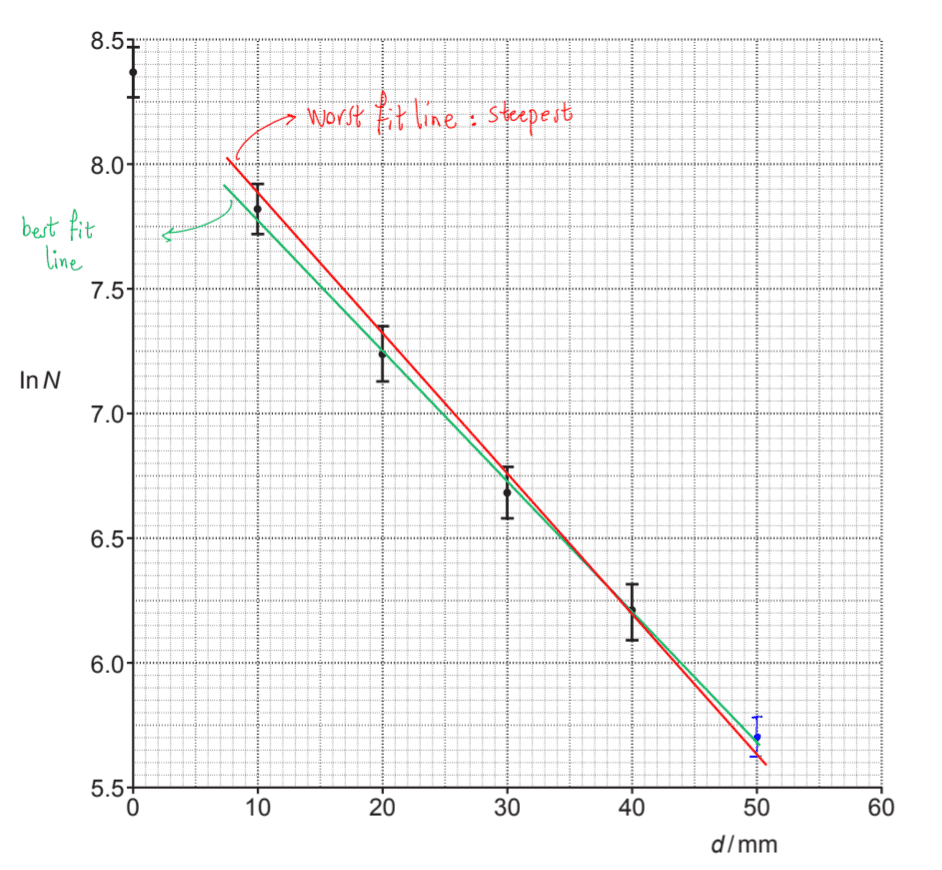
For calculating the gradient, choose points on the line. Try to avoid the actual data points, unless they are right on the line.
1.2.5 Combining uncertainties
When parameters are combined in a formula:
Combination | Operation |
Adding or subtracting values | Add absolute uncertainty |
Multiplying or dividing values | Add percentage uncertainty |
Value to a power: a = bn | Multiply percentage uncertainty by the power: %u of a = n × %u of b |
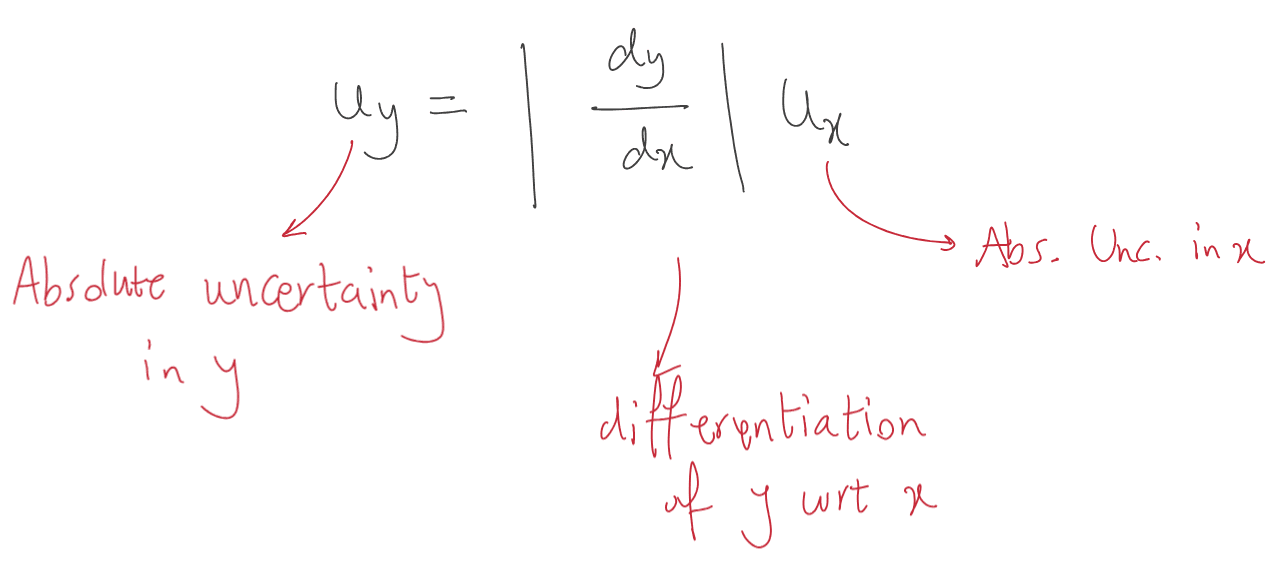
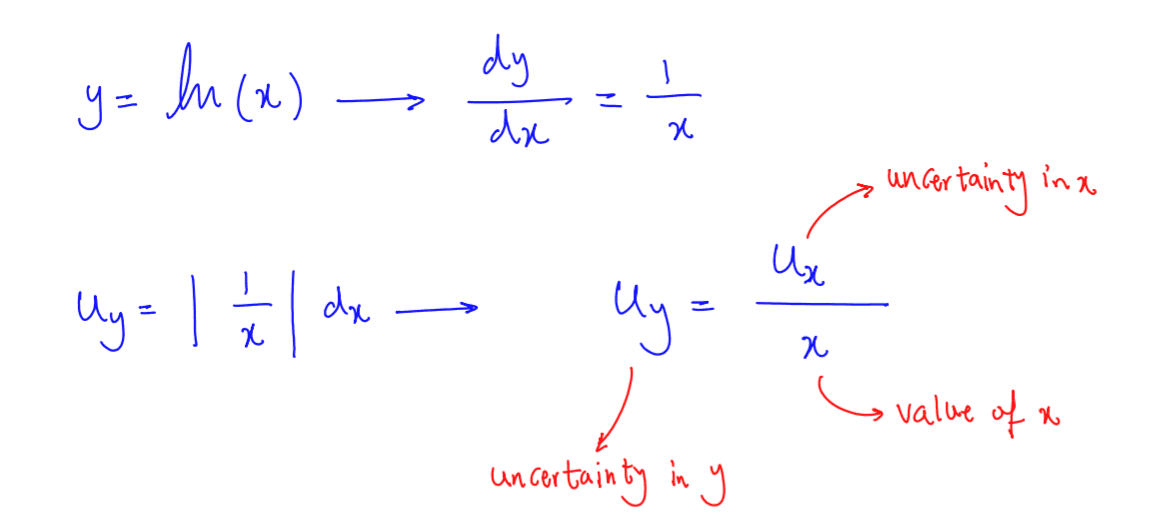
1.2.6 Uncertainty propagation through a function (not AQA)
For a quantity y=f(x), if the uncertainty in x (ux) is small, the uncertainty in y (uy) is approximately:
1.2.7 uncertainty in y = ln(x) – (not AQA)
Example 1:
Q2 - Paper 3 – OCR unified physics 2019
Solution:
According to the formula derived at the top:
But the mark scheme says:
1.2.8 Errors
Parallax: happens when position of an object seems different if viewed from a different angle.
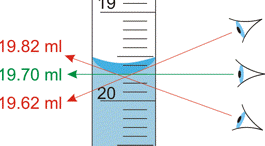
This can happen with a measuring cylinder or an analogue voltmeter etc.
Zero error: when a device gives a reading when it should give zero!
e.g. when there is nothing on the top pan balance and reads something other than zero!
Systematic error: an error that is consistent in every measurement or reading.
This can happen because of:
Bad technique e.g. parallax error every time;
Zero-error on the instrument is not correct;
Badly calibrated instrument.
Systematic error will not be reduced by repeat measurement, because it is consistent in every single one!
If we use different devices we may notice the systematic error.
Random error: as the name suggests these happen randomly!
They may happen because:
Error of the observer (human error);
Something is difficult to read, e.g. PD is changing quickly while reading the voltmeter;
External effects, e.g. unpredictable changes in temperature or pressure of gas.
Repeat measurements and averaging can reduce the effect of random errors.
When we draw a best fit line, we are taking an average of the data!
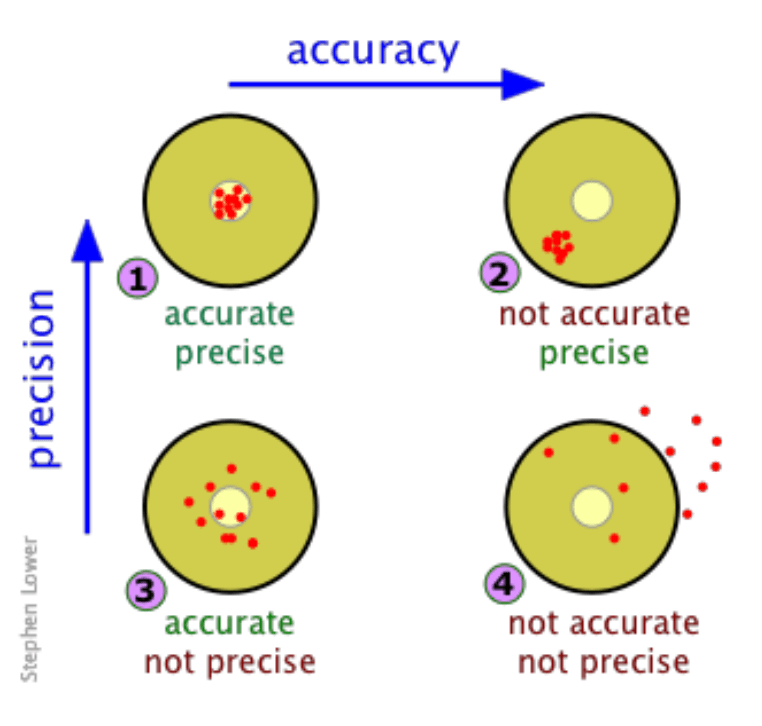
1.2.9 Accuracy vs. Precision
Accuracy: when data are close to the “true value”.
Precision: how close the repeated measurements are to each other.
Data can be precise but far from the true value!
Repeatability: when repeated measurements by the same person in the same lab using the same method gives precise data.
Reproducibility: when repeated measurements by the different people in the different lab using the same method gives precise data.
.
Revise and Get Paid!
If you like taking summary notes of lessons and solving past papers, see the Join Us page!